Urban Fieldworks
Urban Fieldworks is an exercise that investigates the ordinary happenings and encounters found within an urban landscape.
Green Man Time
In this exercise, we aimed to investigate the duration of the ‘green man time’ and its correlation with the width of the signalised pedestrian crossings.
We selected twenty random pedestrian crossings from Rochor to City Hall to help determine if longer roads would lead to a longer crossing time, in which three attempts will be conducted at each one for increased accuracy of data.
We did more research and found an article by LTA about the Green Man + and signalised pedestrian crossings (link here).
Field Trip
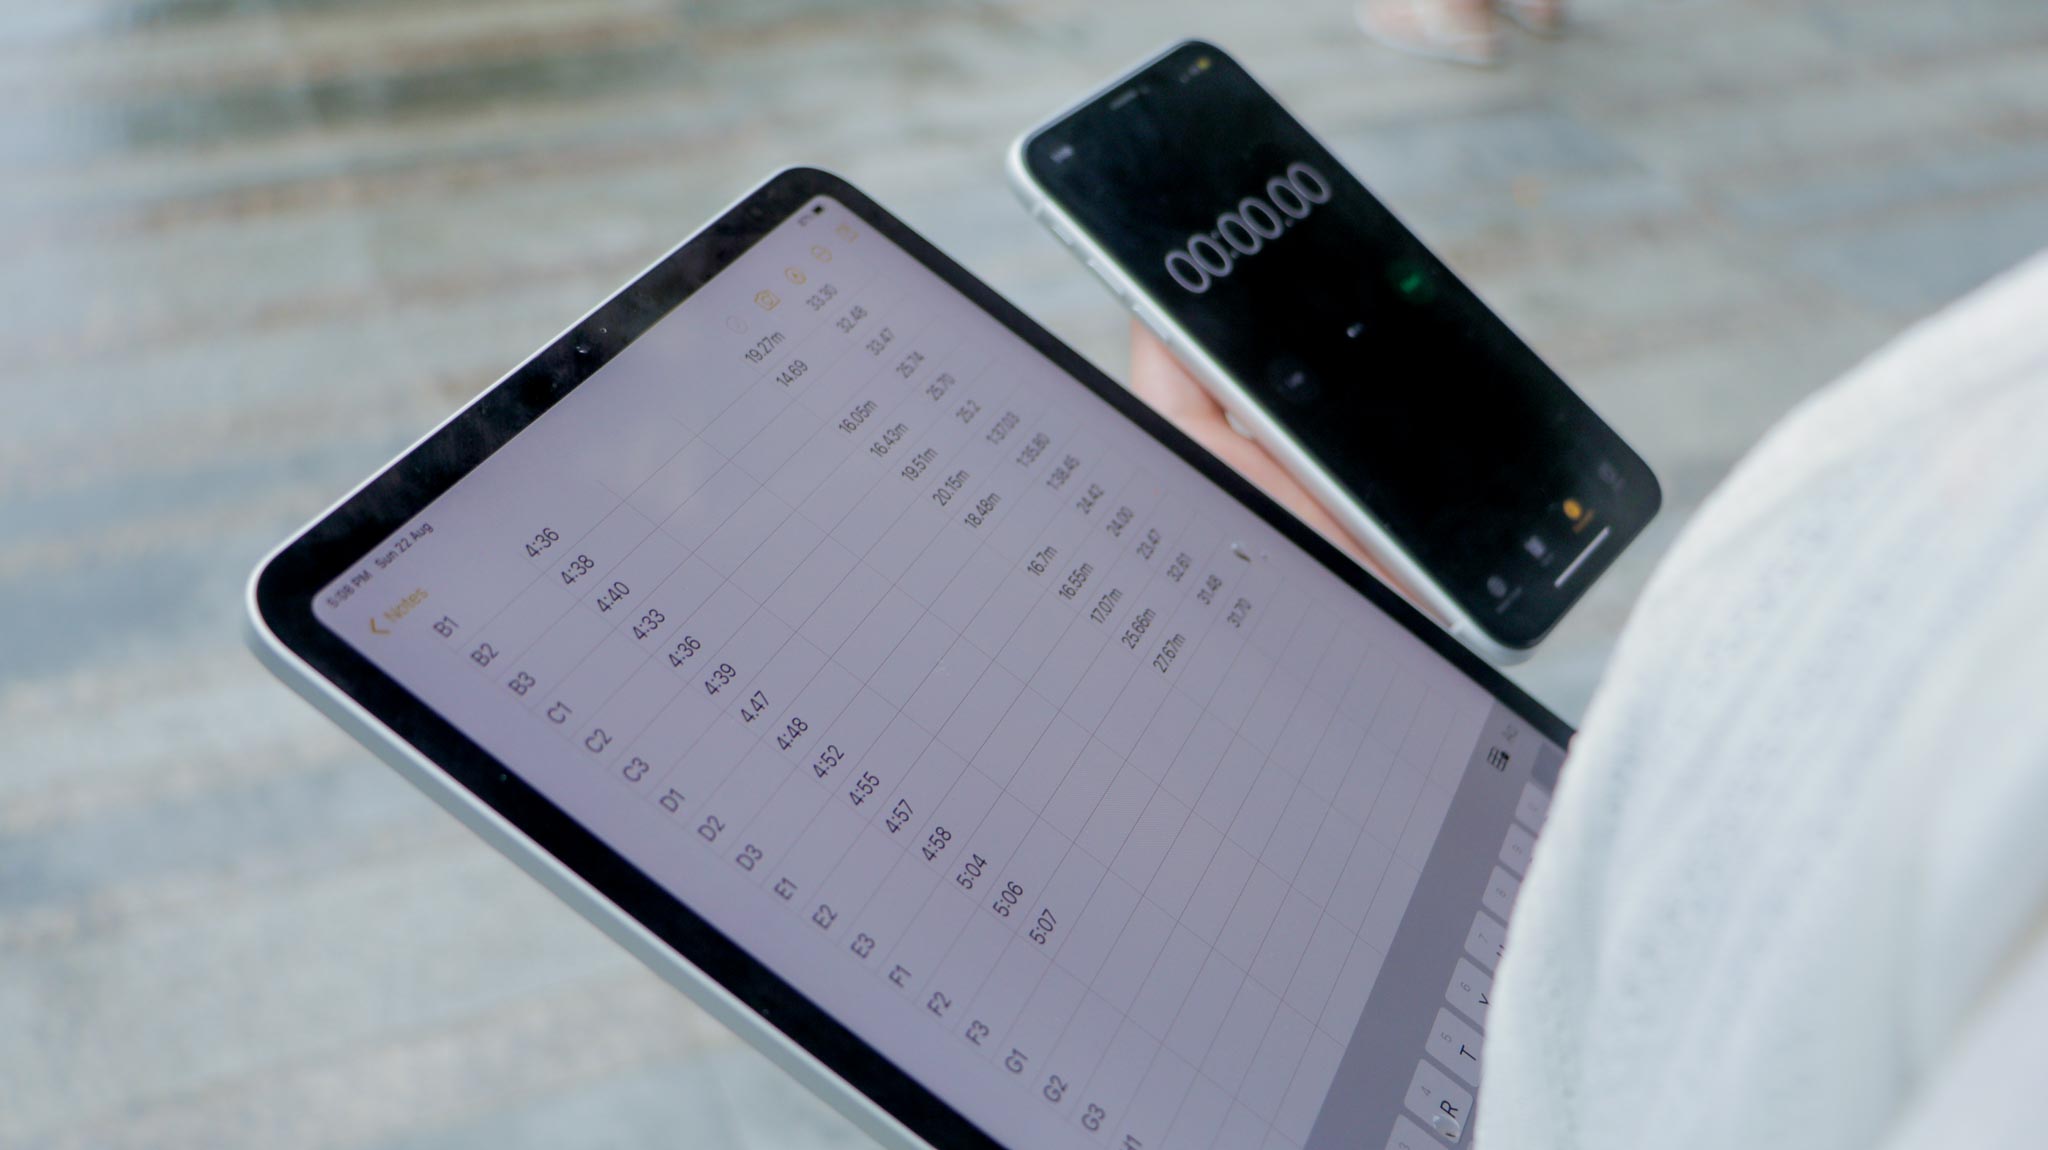
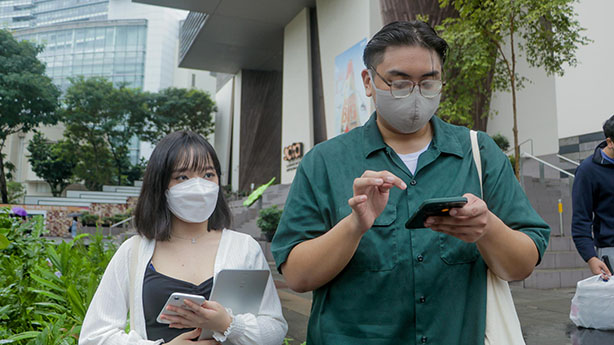
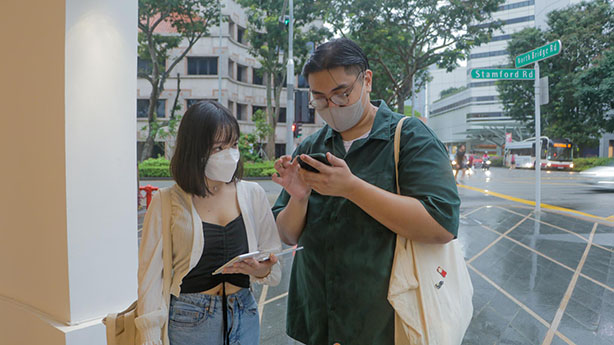
Our mobile phone applications aided us in the execution of the project, where the measuring app was used to track the width of the road as well as the monitoring of the geolocation coordinates.
The recording of data and measuring of the duration were also done through the existing stopwatch and notes applications, which later would be transferred to an excel sheet for better data organization.
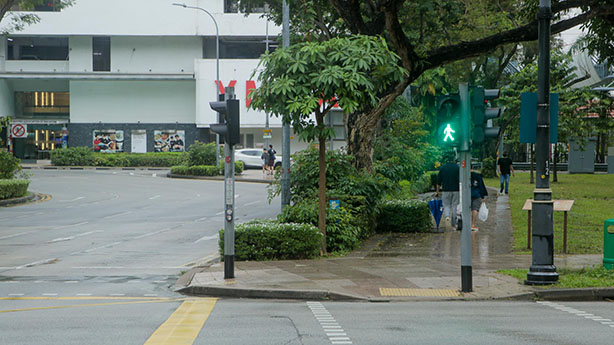
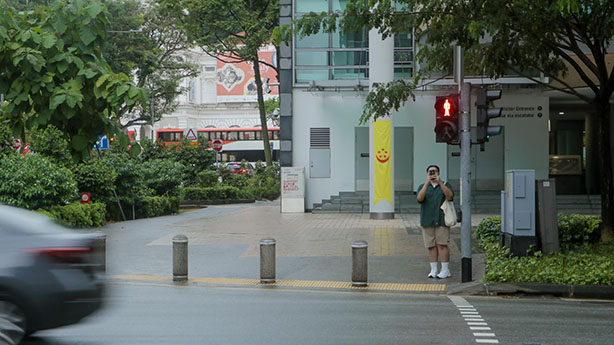
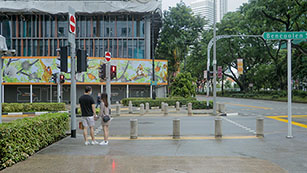
Our Field Trip Gallery

Data
After finalizing our data in a spreadsheet, we downloaded it as a .csv file and uploaded it onto a provided p5js sketch template. From there, we did three sets of bar and line graphs to visualize the data collected from the field trip.
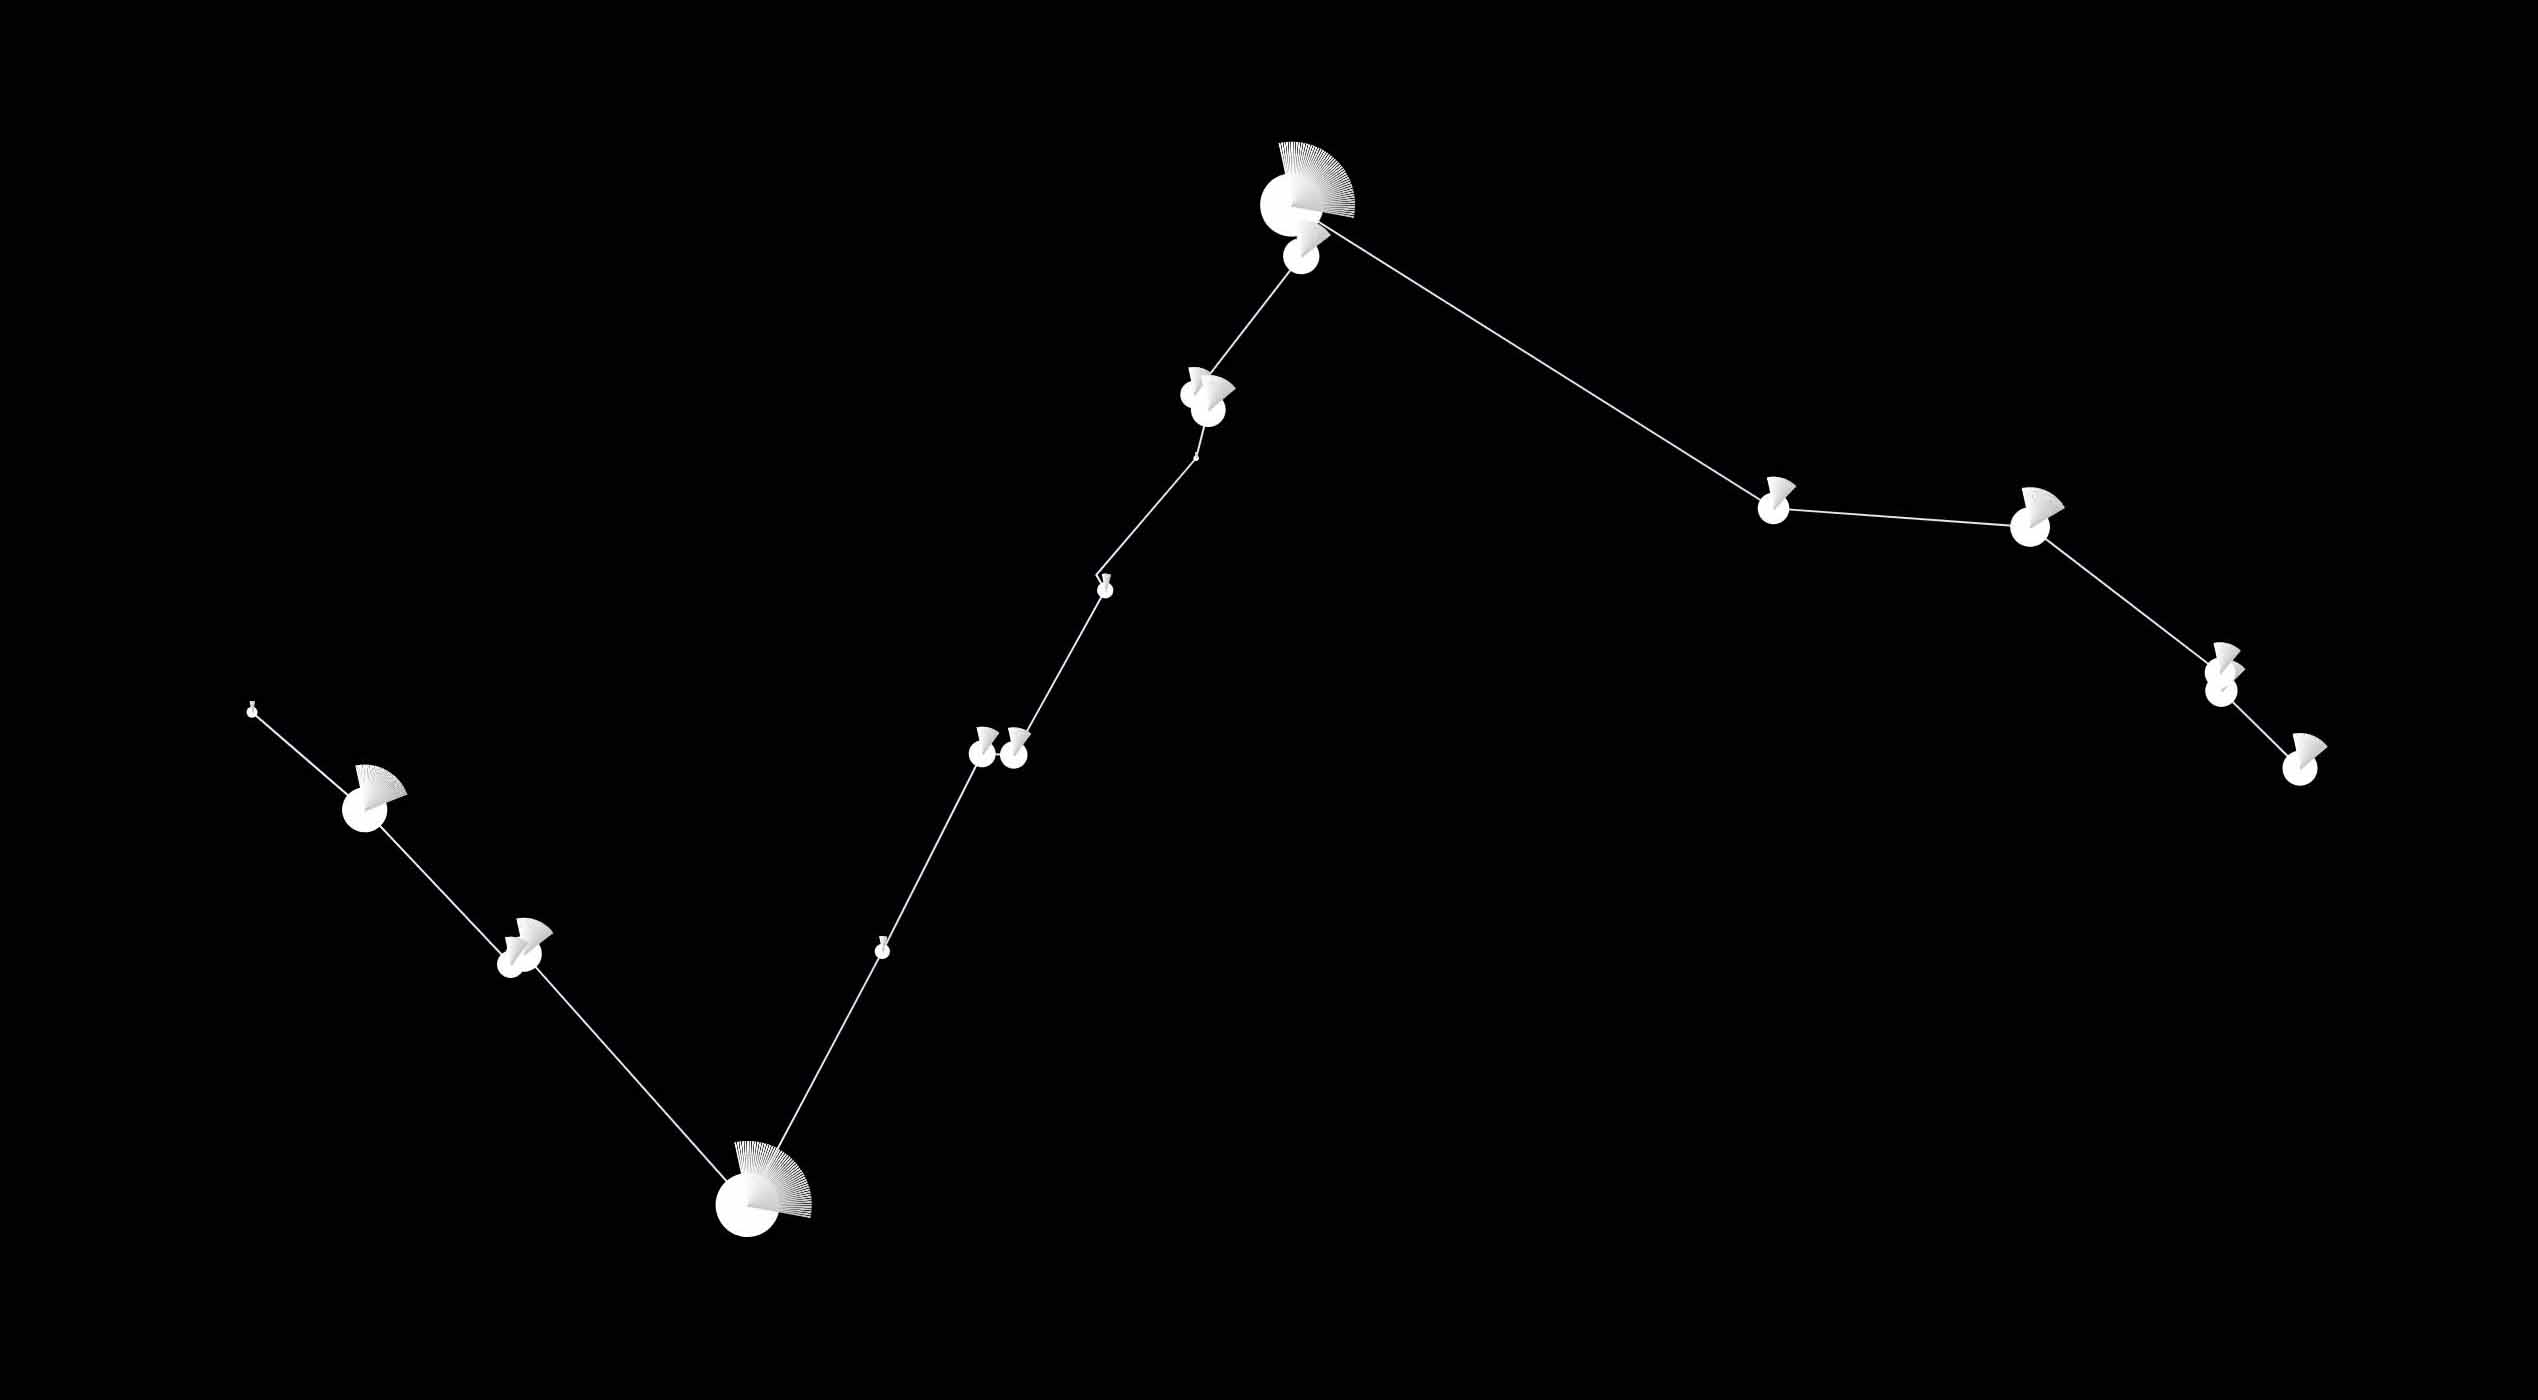
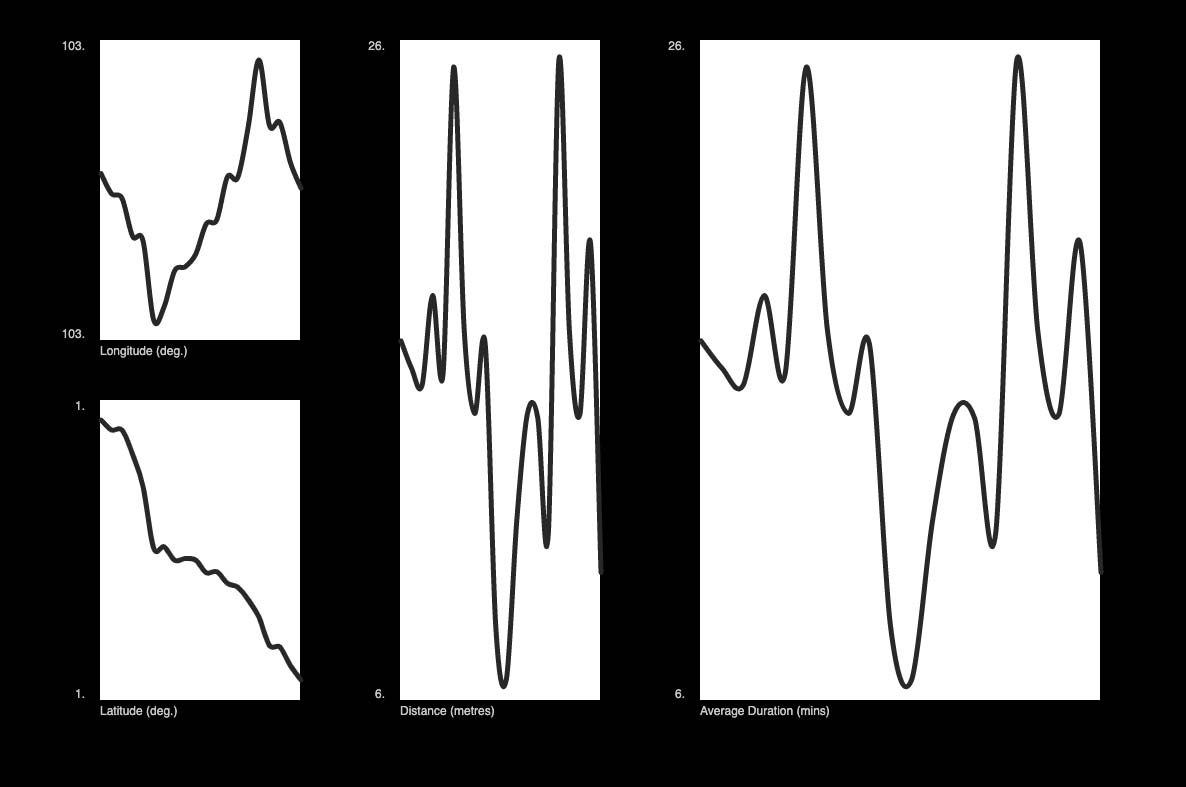

From the graph above we can conclude the following: Longer crossings does not necessarily mean that a longer ‘green man time’ will be given.
Different factors are involved when it comes to the ‘green man time’ like flow and density of traffic and location of the crossing. Here are some data set used for the graphs.
| Duration (min) | Distance (m) |
|---|---|
| 0:22:19 | 17.86 |
| 1:37:09 | 19.32 |
| 0:23:05 | 15.53 |
| 1:56:30 | 11.68 |
| 0:21:48 | 10.41 |
Artefact
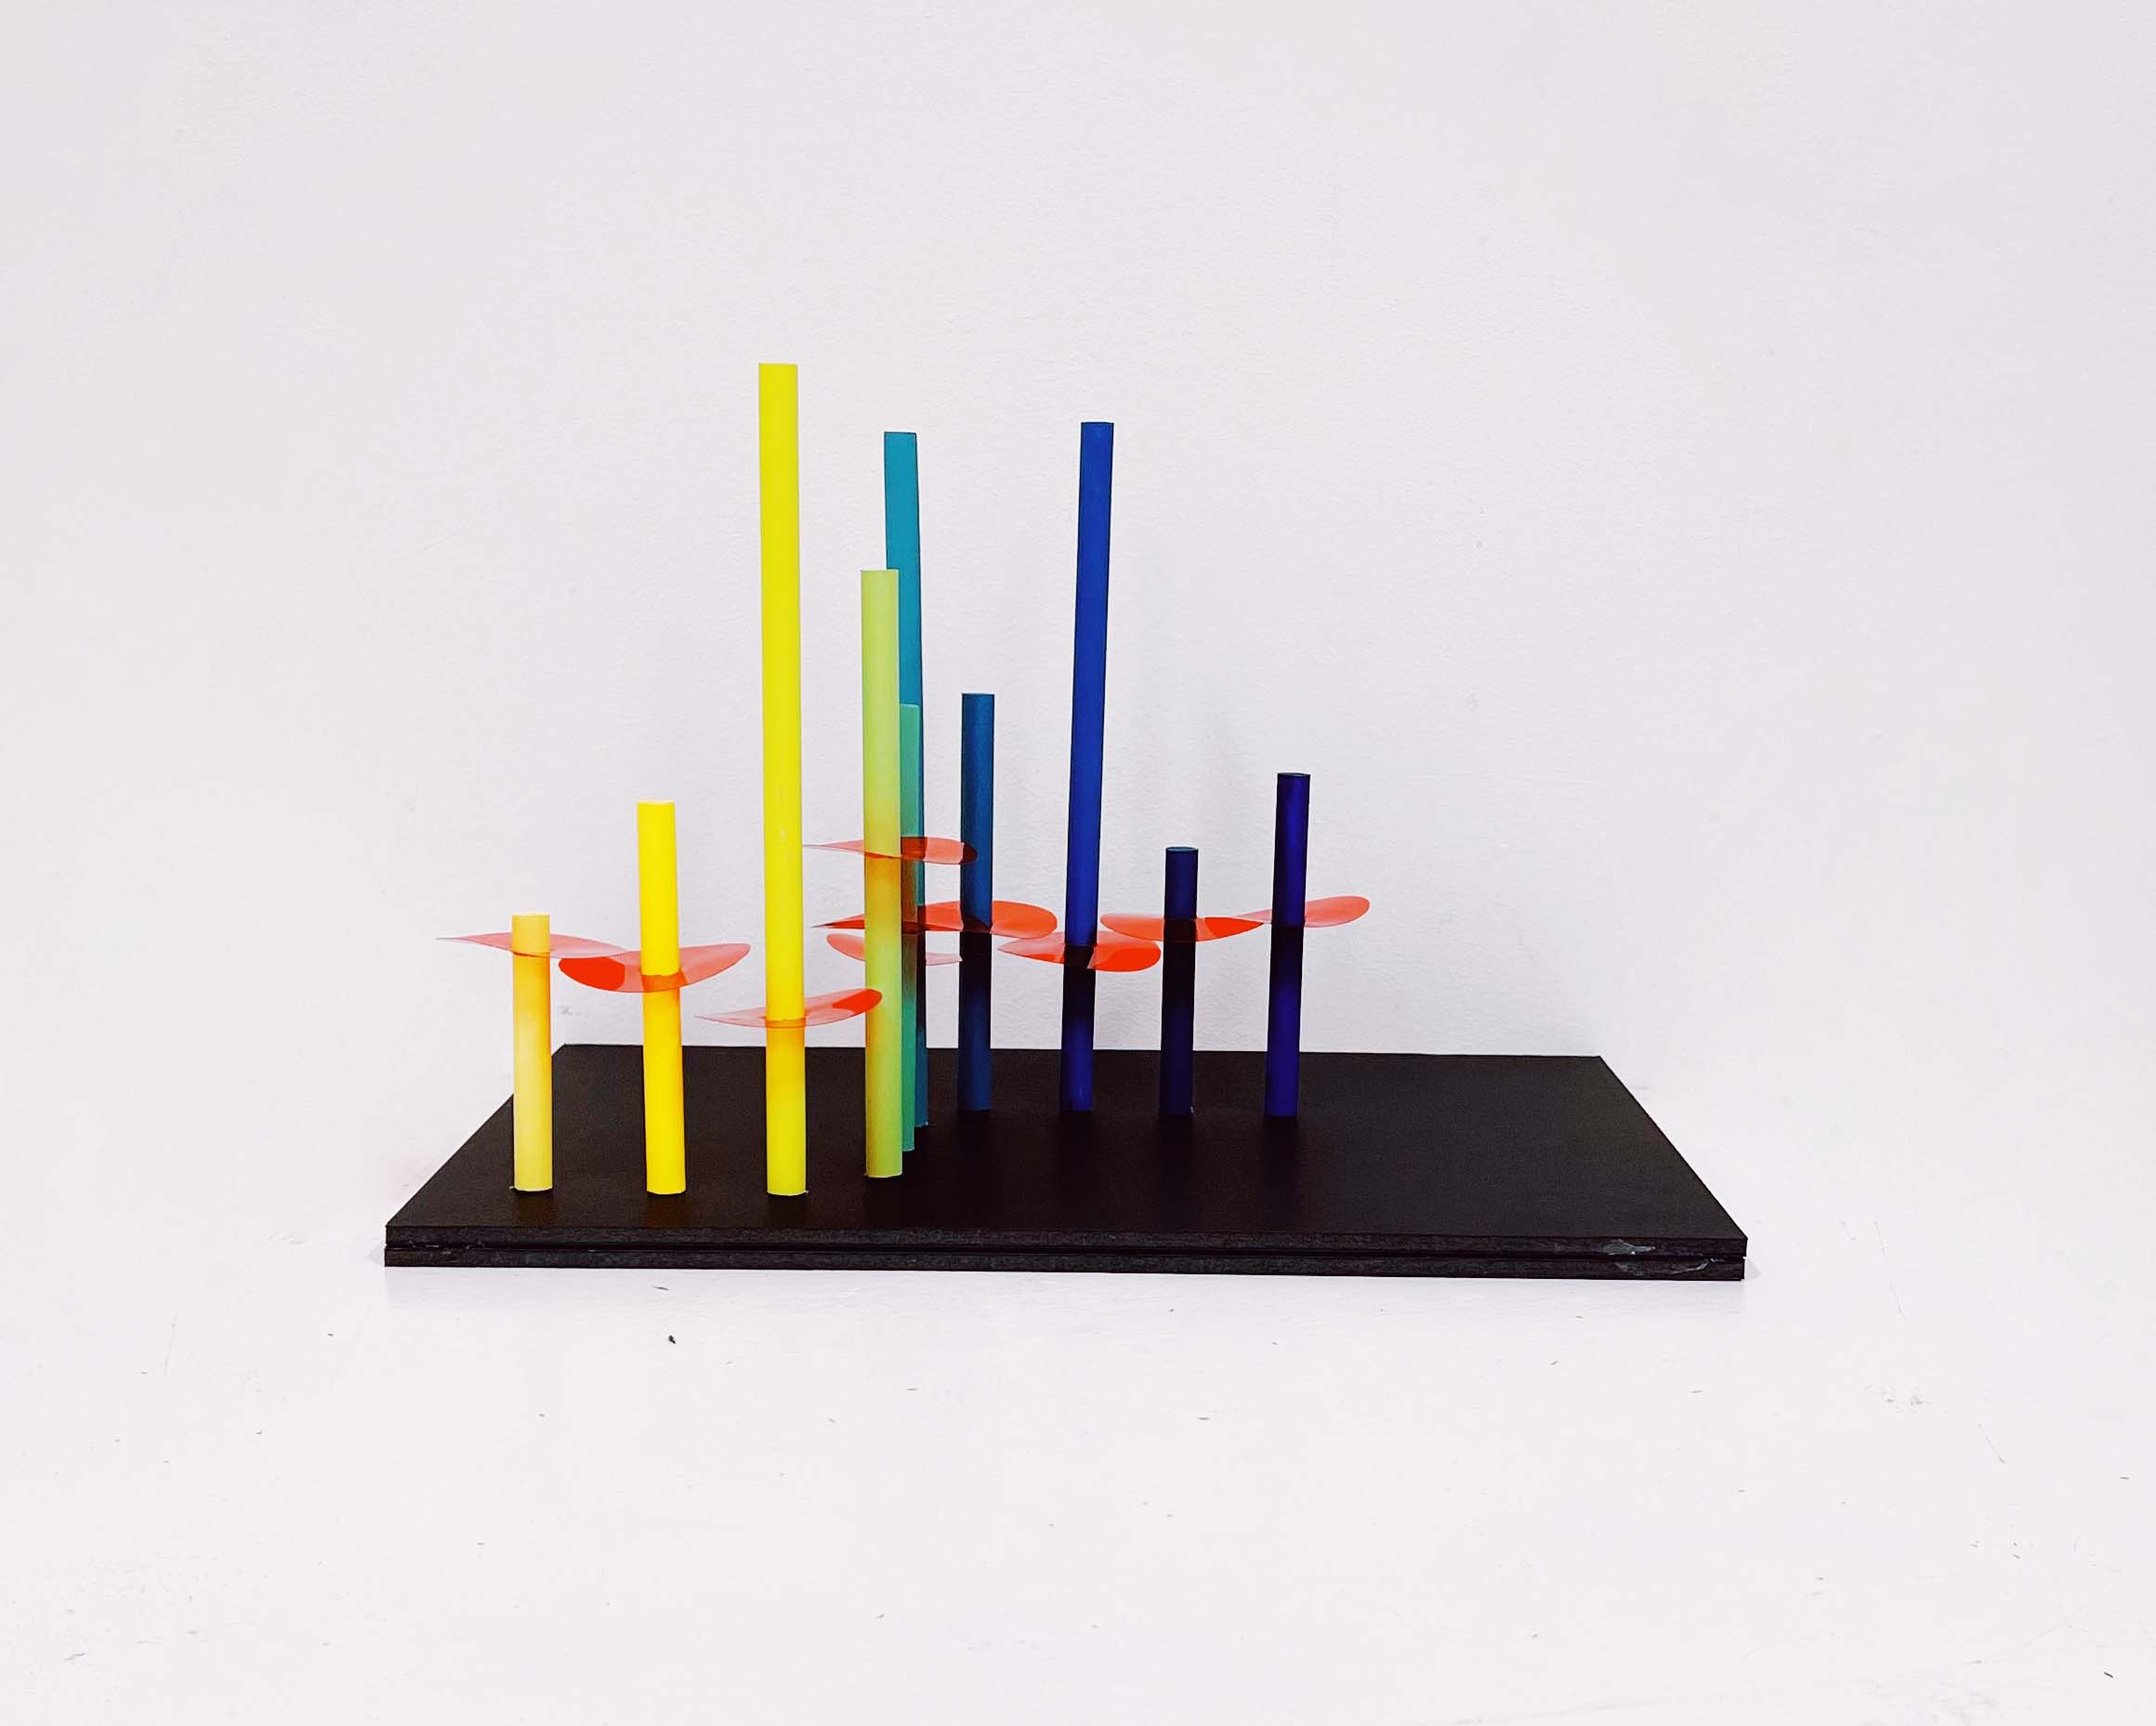
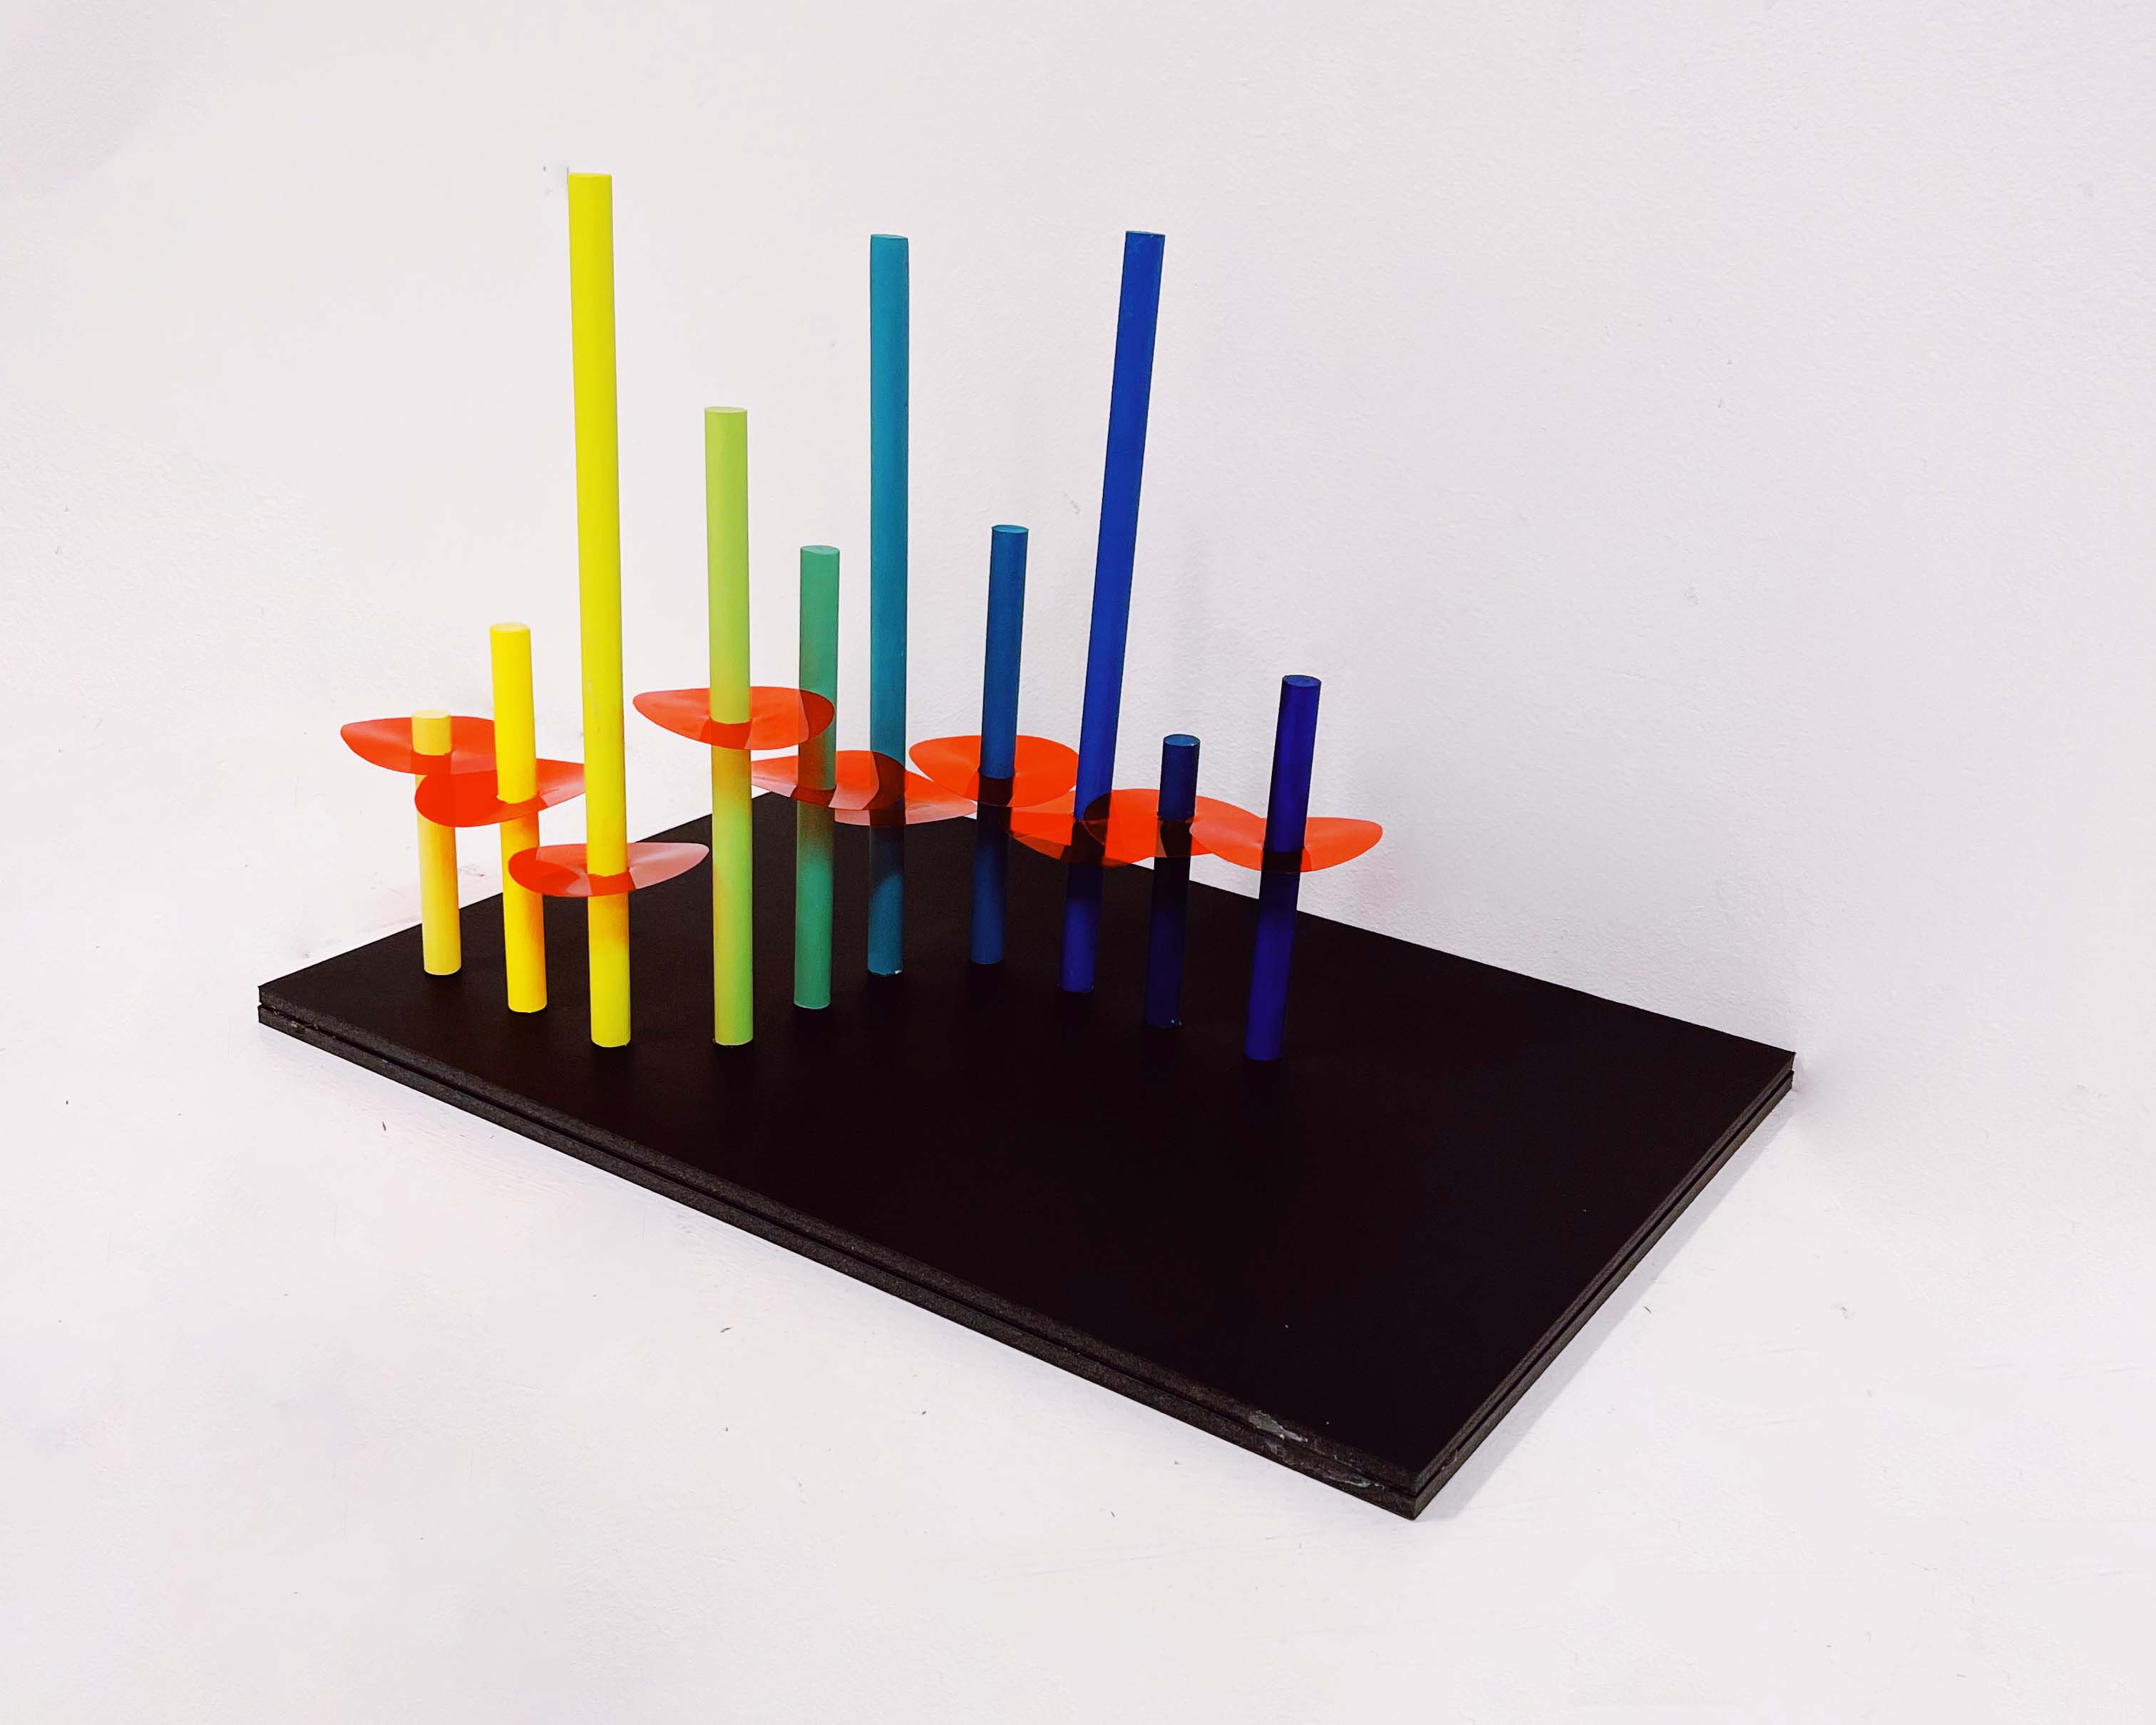
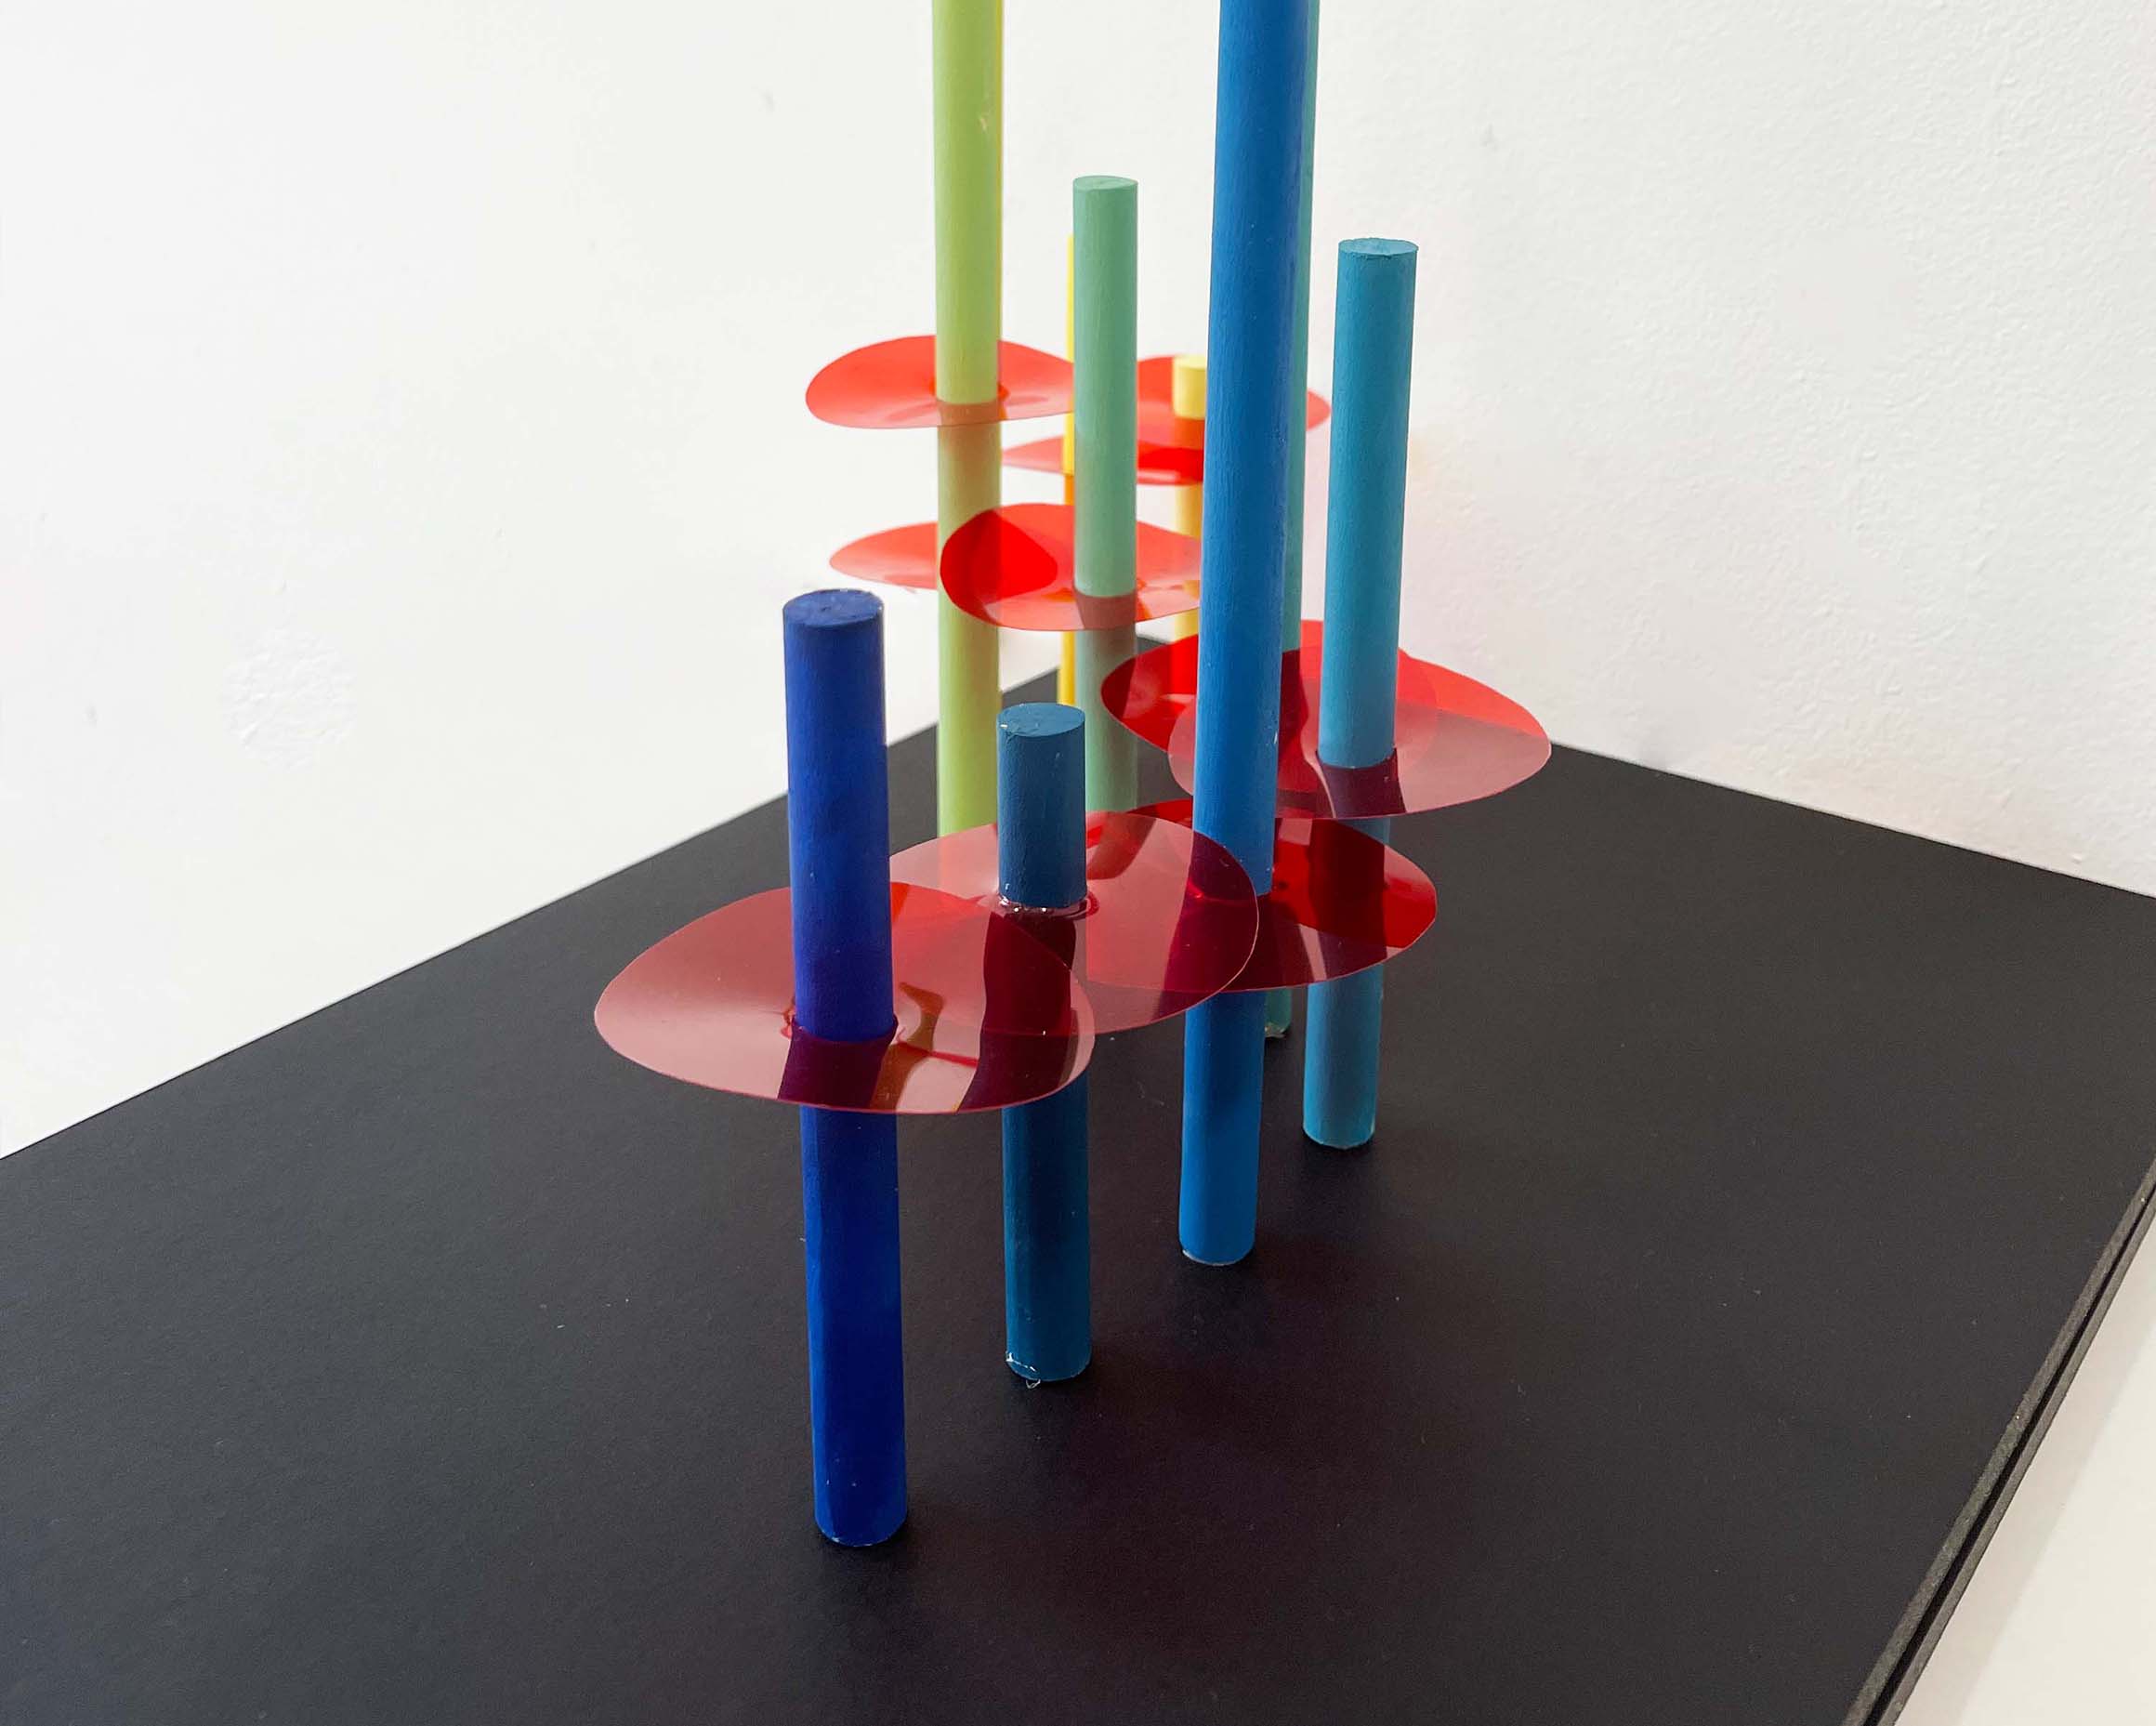
We decided to come up with two artefacts; one data generative code and one data physicalization. For our code, we used traffic light colors to play with random shapes and lines to create a crazy geometric artwork. Next, we recreated the data visualized from the first line graph and the duration of the green man time with simple materials for the physical artefact.
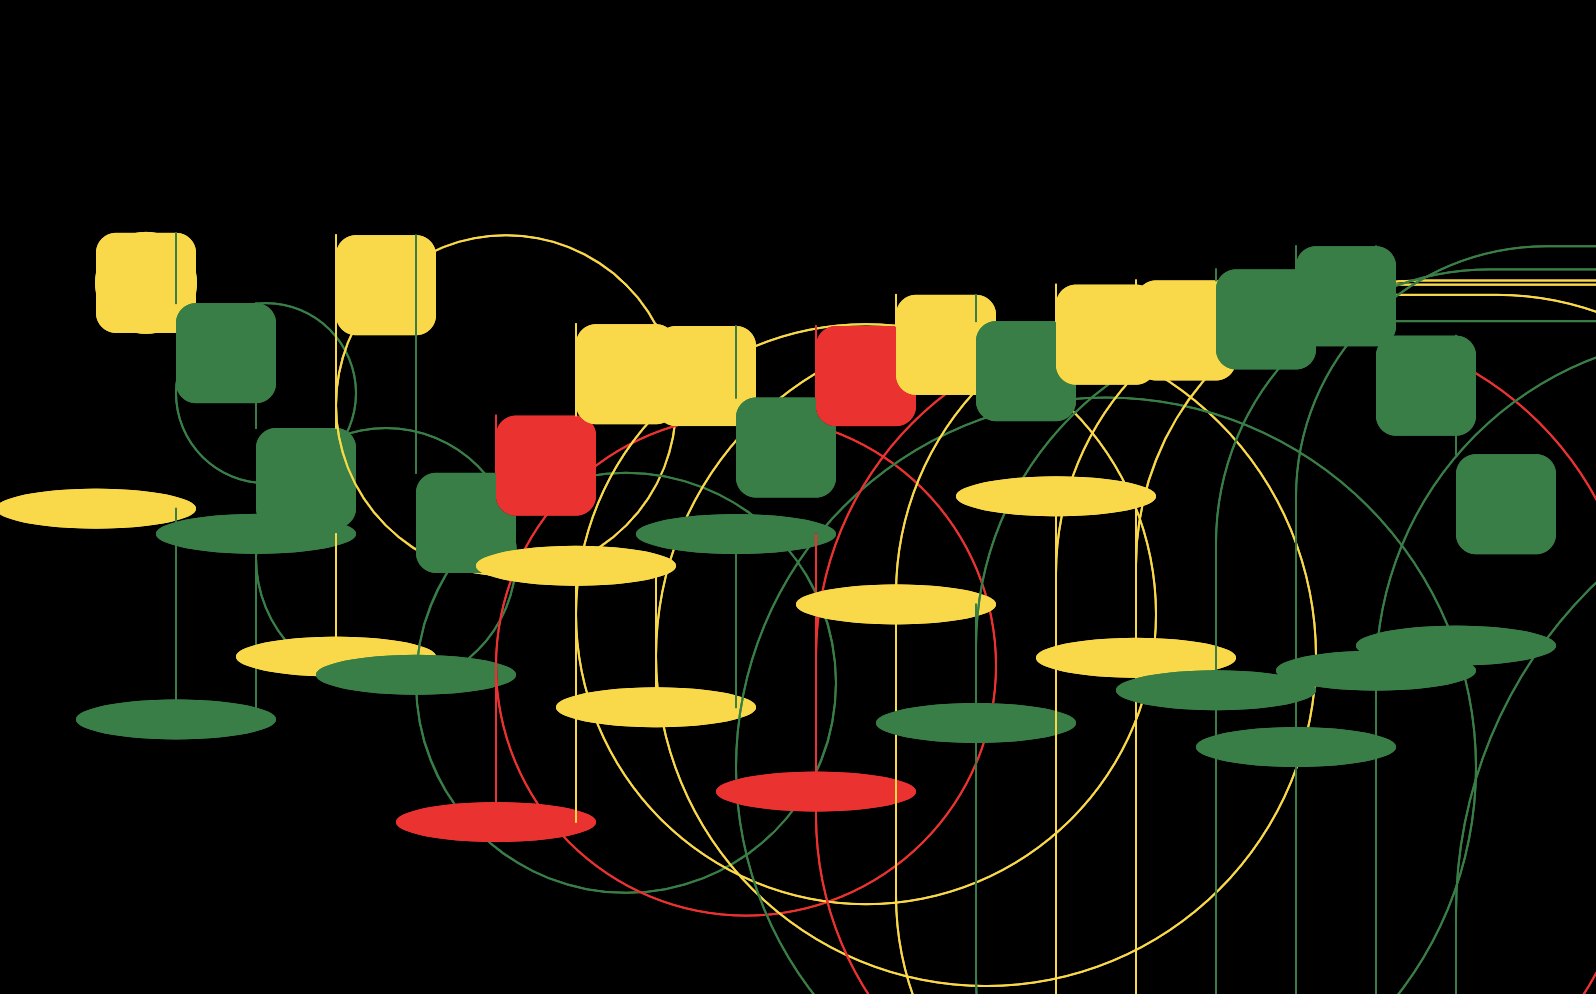
We encountered several problems while making the physical artefact. One main challenge was how to fit the circular red plastic sheets onto the poles without them sliding down. We were not satisfied with our first attempt and explored other alternatives to improve it. The final physical artefact was our second attempt after using a black foam board as the base. Similarly, we also encountered problems with our generative code. The final version was inspired by malfunctioning traffic lights and originated from two simple rows of random circles and lines.
Reflection
Experimenting was a huge part of this whole exercise, as we created both a physical and code artifact for the visual representation of our data. There were many moments when we had to trust the process and continue on even with our doubts. It was overall a great learning experience and we learned things that could help us in future projects.
